Lean Canvas Model
2012
The Lean Canvas is an adaptation of the Business Model Canvas and it is specially designed for entrepreneurs. The canvas focuses on problems, solutions, key metrics and competitive advantages.

April 4, 2022
In today’s digitalised world, it is typically not enough to consider a single provider-customer relationship. Instead, we must consider the overall value network. A value network refers to a set of connections between companies, individuals and other stakeholders that exchange value. All actors of the value network have individual business models that interact with each other to benefit the entire group. Value networks should therefore develop a convincing value proposition for the group, even if it implies changes to the current business models of the individual actors in the group.
Many companies generate revenue from intelligently managing or positioning themselves in a particular value network. Going forward, companies will need to place a stronger focus on redesigning value networks, not least because digital business models require them to work more closely with their customers, suppliers, competitors and other network stakeholders. Accordingly, companies need to adapt the way they think towards a vision of an interconnected industry that provides profitable and sustainable value propositions.
Thus, the starting point for this vision is for all actors to understand the value network they are part of and how their business model contributes to it.
Developing a profitable and sustainable value proposition that serves the needs of one’s customers is an important step towards the long-term success of the business model. Aligning that value proposition with the value proposition of one’s value network is the next step. The methodology for Value network mapping sets out a systematic approach for conducting an in-depth analysis that enables any actor to illustrate and describe the value network in simple terms.
The Working Group on Digital Business Models in Industrie 4.0 suggests a conceptual methodology to analyse practical examples. Below, you can find an illustration of a simple value network.
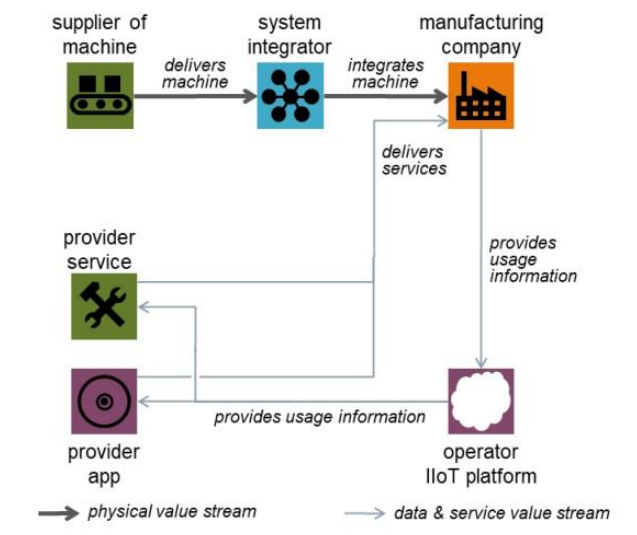
A value network is illustrated by directional graphs consisting of nodes and edges. Each node represents a specific business role in the network. Each edge represents a value stream, and the edges of the graphs thereby indicate the relationships of value exchange between the business roles.
The business roles are assumed by various network actors in terms of companies, individuals or other stakeholders. This is indicated by colour coding the business roles whereby one colour represents one actor – and different colours represent different actors. One actor may take on several business roles, thus, business roles coded by the same colour are assumed by a single actor. For example, the value network illustrated above consists of six business roles, which are assumed by four different actors.
Each actor takes part in the value network based on an underlying business model. The business model defines the ability of each actor to contribute to the shared value proposition of the overall network. Therefore, the Value network mapping shall include the business models of each actor in the value network, as illustrated below.
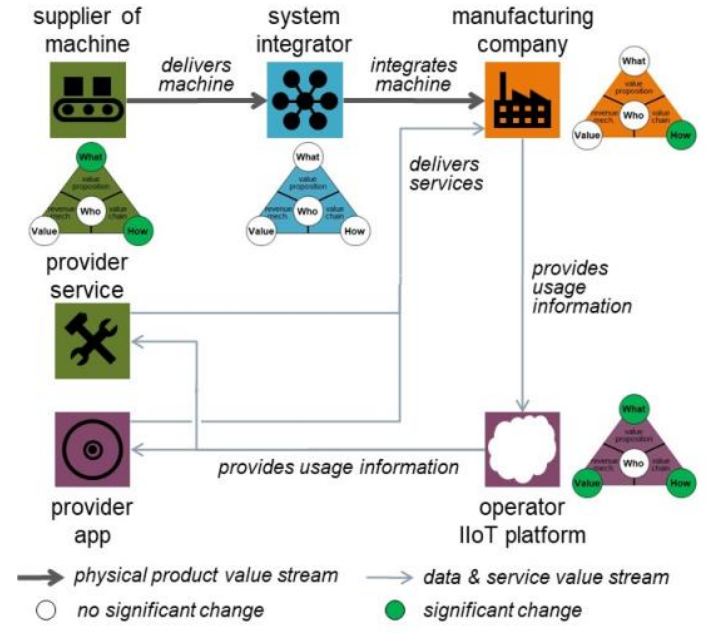
The business models are illustrated by the tool St. Gallen Magic Triangle by St. Gallen Magic Triangle-Business Model Navigator (Gassmann et al., 2019), which defines the four business model dimensions of “who” (customer), “what” (value proposition), “how” (value chain) and “how/value” (revenue mechanism). When a new actor enters a value network or an existing actor introduces a new business model, dimensions in the business models of the remaining actors can change significantly as a result. ‘Significant’ means that the considered dimension is addressed structurally in a different way. Dimensions that change significantly are indicated by being coloured, and dimensions that do not change significantly are indicated by being left blank.
The number of dimensions that change significantly defines the nature of the innovation practised by each actor. If one or none of the dimensions change, it is product or process innovation, and if two or more dimensions change, it is business model innovation. For example, the business models of the four actors illustrated above consist of two product/process innovations and two business model innovations.
Hence, by considering the business models of the other value network actors, you will quickly be able to determine which roles are significant for the shared value proposition of the network and which roles may be dispensable. This is valuable insight to determine the position of your own company and understand how the changes you implement in your business model can affect the business models of the other network actors and vice versa.
Set aside two hours for mapping and describing the value network.
It will be an advantage to involve a number of key employees at the strategic level of your company who are able to bring different ideas and points into play. Measures should, however, be taken to avoid too many diverse departments being represented in the group. For one, because the mapping exercise should focus on the core network and keeping the number of business roles to a minimum, and for another, because employees in different job functions often collaborate with different external actors, thereby making it difficult to arrive at any conclusions.
Furthermore, the mapping exercise should be performed from the perspective of your own company by considering your own company as the centre of the network. You may draw inspiration from a ‘similar’ example, but it is essential that you modify it to fit your purpose. Finally, keep in mind that designing a value network is a creative activity and that the mapping process itself is an excellent way to create a common understanding of the synergies that business model changes can create in the network.
You will need a whiteboard, whiteboard markers, some sticky notes (Post-its) in different colours and pens (one for each participant). In principle, the results of the mapping can be drawn and written directly into a blank document on a computer, but it is highly recommended to do it physically, as it is much more flexible and makes it easier to stay focused. In case you prefer to do the mapping virtually, AIOTI WG Smart Manufacturing has prepared a template to support you. You can download the editable template below.
1) Brainstorm the various business roles in the network that surrounds your company and write them down on the whiteboard.
2) Shift focus to the actors in the network and keep in mind that one actor can assume several business roles. Select a Post-it colour to represent each network actor. Write down the business role(s) assumed by different network actors on the different coloured Post-its. Put all the Post-its on the whiteboard. Notice that the number of different colours indicates the number of different actors that participate in the value network.
3) To connect the business roles, use a whiteboard marker to draw lines between the business roles that have some sort of value exchange relationship with each other, and for each line, consider what value stream these two specific business roles deliver to each other. Note down the value stream and highlight (either by thickening the line or using a whiteboard marker in a different colour) whether the value exchange is based on a physical product or on data and services.
4) You now have a clear overview of the network that surrounds your company and the exchanges of value that take place within it. Likewise, you have a clear overview of the different business roles and specific actors that are part of the network – and now it is time to explore the business model of each of them. To this purpose, use the Magic Triangle, a methodological framework of the St. Gallen Business Model Navigator (Gassmann et al., 2019), to discuss and describe the four dimensions:
For a more elaborate introduction to the Magic Triangle and a step-by-step guide, click here.
5) Define a scenario of change. The change must be initiated by one of the network actors – it could be a change that your company considers implementing or it can be a change that you expect one of the other network actors to implement. Write down the scenario of change on the whiteboard.
6) Now consider how the scenario of change impacts the business models of the various network actors. Next to each network actor, draw a business model in the format of the St. Gallen Magic Triangle. One by one, go through the business models of the network actors and colour the business model dimension(s) that change significantly due to the scenario. Examples of significant changes could be when a new market segment is addressed (who), a digitalised version of a physical product is introduced (what), a new business partner is integrated into the value chain (how), or recurring usage-based payment is introduced instead of one-time payment (value). Based on the number of coloured dimensions in each business model, you are now able to answer how many business innovations the change scenario will affect.
7) It is now time to evaluate the result of your value network mapping. Do you see a convincing value proposition for the group – before the change vs. after the change? Do the business models of the group interact with each other to benefit the entire group? How close do you work with your customers, suppliers, competitors and other network stakeholders? Is your business role important for the value network? Does your business role contribute to the vision of an interconnected industry that provides profitable and sustainable value propositions?
Your answers to these questions will provide you with a knowledgeable foundation for determining how specific scenarios of change will positively or negatively impact your company as well as predict the effects it may have throughout the network.
The result is that you now have an overview of your value network as well as valuable insights to determine the position of your own company and understand how changes you implement in your business model can affect the business models of the other network actors and vice versa. This will help your company unleash its potential to generate revenue by intelligently managing or positioning itself in a particular value network.
By mapping and analysing your value network, you are able to:
A range of examples exists to support companies in the mapping of their value network. Below, the business case and value network of Aguardio are presented for inspiration.
Aguardio business case introduction

Water scarcity has become a global challenge as water resources are under pressure from climate changes and population growth. In many parts of the world, the availability of water is predicted to decrease, while the demand is expected to rise. It may only be a matter of time before our planet will be in a water deficit if no action is taken on demand management.
Aguardio recognises that an extensive behaviour change in the population is required to reduce the overall water demand of the planet, and the company has developed an IoT solution with complementary data-driven services to help users make a conscious choice to reduce water and energy consumption.
The interactive plug-and-play device is installed in the shower, where it guides people towards sustainable behaviour and awareness by discretely pointing the user in the right direction towards taking shorter showers. The device simply nudges people towards more sustainably conscious decisions, leading to savings in water, energy, carbon emissions and money.
Value network

In the value network, Aguardio is developing and offering the smart sensor device and its integration services as a complete solution. The physical device is installed in the showers of commercial customers, typically housing associations, which benefit from the accumulated reduction in water and energy consumption made by the individual residents of the housing associations. This generates financial gain as well as sustainable brand equity.
The IoT platform for the solution is Microsoft Azure, which brings value to Aguardio in the form of the specific services and applications that the platform contains. The data collected by the sensors is stored in the cloud from where it is also analysed. Aguardio takes the role of data analytics provider, as they deliver value to the housing association in form of aggregate data on the residents’ water and energy usage. For this purpose, the housing association has its own portal where it has access to stored data and analytics.
Finally, Aguardio also has the role of data analytics services provider. For example, when leakages occur, an alarm will sound to inform a connected maintenance service provider of the leakage. The maintenance service provider (who may be hired by the housing association) can then react to the alarm and stop the leakage.
Business model innovation
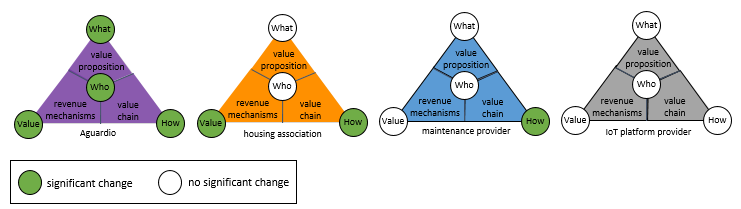
The value chain provides sustainable and financial value with completely new digital solutions, and the key activities to operate the business model are to develop and produce the devices. Aguardio is hereby establishing itself as a new stakeholder in the value network, and all four dimensions of the company’s business model change significantly.
For the housing association and the maintenance provider, the solution targets the residents of the housing association. It contributes to answering the question of how they operate their business model, and it changes their current operations to a more collaborative scheme in which sustainable behaviour is a shared value proposition. For the housing association, the financial savings generated from the devices will furthermore impact the revenue mechanism. For the IoT platform provider, the role of its business model in the value network is business as usual.
The Aguardio example, along with many more, can be found in the white paper from 2022 “Business Impact of IoT in Manufacturing Industries (Release 1.1)” by AIOTI WG Smart Manufacturing.
Common to the available examples is that they demonstrate various business scenarios according to the value network mapping methodology as well as illustrate the various ways that the development and deployment of IoT can impact the design of business models.
Further knowledge of the methodology, value networks and digital business models can be found in the original paper “Digital business models for Industrie 4.0” by the Federal Ministry for Economic Affairs and Energy (BMWi) from 2019.

The content elements above have been developed through the EU-IoT project by Aarhus University, Martel Innovate, Netcompany-Intrasoft, Fortiss, BluSpecs and funded by the Horizon 2020 Framework Programme under topic ID ICT-56-2020, grant ID 956671.
EU-IoT is the European IoT Hub. The EU-IoT project works towards growing a sustainable and comprehensive ecosystem for Next Generation Internet of Things.
