February 16, 2024
Before you start
This learning module is part of the building block:
The module in brief
After having drawn the model of the system, the next step in risk management is to take a closer look at the “values” in the system – also called “assets”.
Purpose of asset identification
In essence, risk management focuses on creating an overview that will facilitate informed decision-making. Prior to the actual risk analysis, the first step is to identify the assets, after which potential threats to those assets can be evaluated. The purpose is to establish the necessary overview of assets that will serve as the foundation for the risk assessment.
Practical information
To identify various risks in the system, one can examine the elements in the system that have or create value. In general, the easiest approach to identifying assets is to organise a workshop lasting a couple of hours (depending on the system to be analysed), followed up by some descriptive tasks if needed.
Generally, it is advisable to strive for diversity in this process, ensuring that both individuals with business understanding and technical insight participate. If, for example, only technical experts are involved, there is a risk of missing important business aspects. On the other hand, business people may not necessarily possess the required technical knowledge about how the system is built, which could lead to unintentional omissions here as well.
In the context establishment, a number of stakeholders were identified. The list should include all relevant individuals, but if a risk assessment is carried out for the first time, the list may have to be revised.
Step-by-step guide
The process of identifying the assets follows two overall steps.
- Identification of assets
Do a brainstorm to identify the assets related to the system. It’s better to start with too many assets; they can always be removed later if they turn out to be irrelevant. - Consolidation and verification of assets
After the brainstorm, the list of assets must be consolidated. You may have to describe some of the assets in more detail, only to realise that they are already included in another asset. Then compare the list with the system diagram to ensure that everything has been included.
Identification of assets
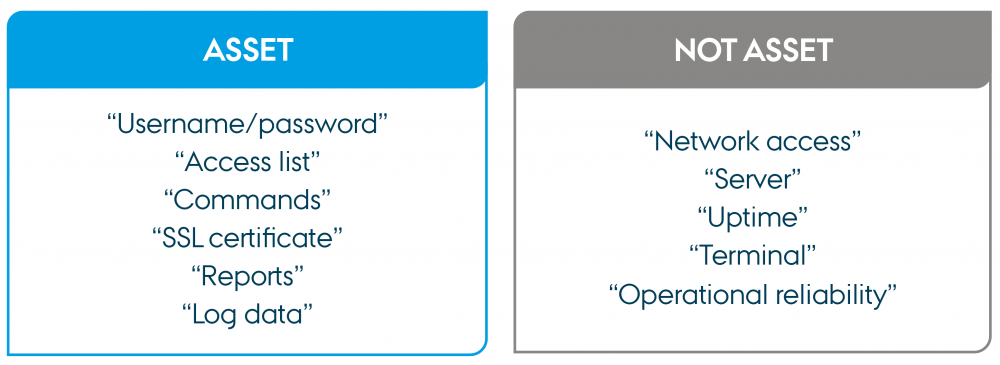
When working with risk management in general, “assets” can encompass a lot of things, from buildings and facilities to employees and knowledge. When dealing with risk management in cybersecurity, it is advantageous to consider “assets” as data. The main reason is that the method described in the following for analysing the consequences of an incident is best suited for information/data and less suitable for physical objects. There may of course be physical items in the system that also need protection; for example, if a sensor is expensive and can be stolen, but this will not be covered by this analysis. Hence, a server or a laptop is not considered an asset, whereas the data stored on the server is.

"Asset - not asset" by CyPro under licence CC BY-SA 4.0
Once the diagram of the system has been created, and you agree on the contents, the next step is to identify the assets. As a starting point, a brainstorming session is conducted where findings are noted. However, to make the brainstorming process more structured and ensure that nothing is overlooked, different methods can be employed:
Method A: Technical and business assets
Using this approach, individuals with business insight describe the data that customers and other stakeholders receive/want, what the data is used for and what is needed to generate this data. At the same time, technical experts examine the data present in the system. This includes what is stored in databases/file systems, data retrieved from external partners, data sent to clients, etc. This will result in a list of assets, comprising both technical and business assets.
Method B: Follow the system diagram
Another option is to follow the diagram you have just have created in the system modelling module. Consider what role each component in the diagram plays and the data associated with each process. In the scenario of a client application accessing a backend, you can for instance examine the client functionality and the data exchanged in that context. This includes components such as username/password for system access, the ability to view devices (and their measurements) linked to the account, the ability to register new devices, and the capability to activate or manipulate a connected device in some way.

"Create asset list" by CyPro under licence CC BY-SA 4.0
Create asset list
Printable version of the tool in large format
Consolidation and verifications of assets
Once you have completed the brainstorming process, the next step is to consolidate the findings. If method A was employed, the list might include very specific technical assets.
Many of these assets can be described at a more general business level if preferred. For instance, "invoices," "orders," "complaints," "contact information," and "delivery address" can be described as "customer data" without losing essential information.
Moreover, it can be a good idea to utilise both approaches to ensure a thorough representation. Even if you think you have covered the entire system, you may discover a component in the diagram that seems not to contain any assets. On the other hand, you may realise that the diagram lacks components that are essential for a vital functionality in the system. In both cases, it is crucial to ensure that the diagram accurately reflects reality.
Initially, it can be challenging to find an appropriate level of abstraction. Firstly, because it might not be relevant to distinguish between components that one initially perceived as distinct assets. Secondly, there is a risk of defining an asset in such broad terms that further elaboration would require different versions depending on the context in which the asset is analysed.
IoT door lock example
Let us look into our IoT door lock example.
We start with a brainstorm session, where we identify both business and technical assets.
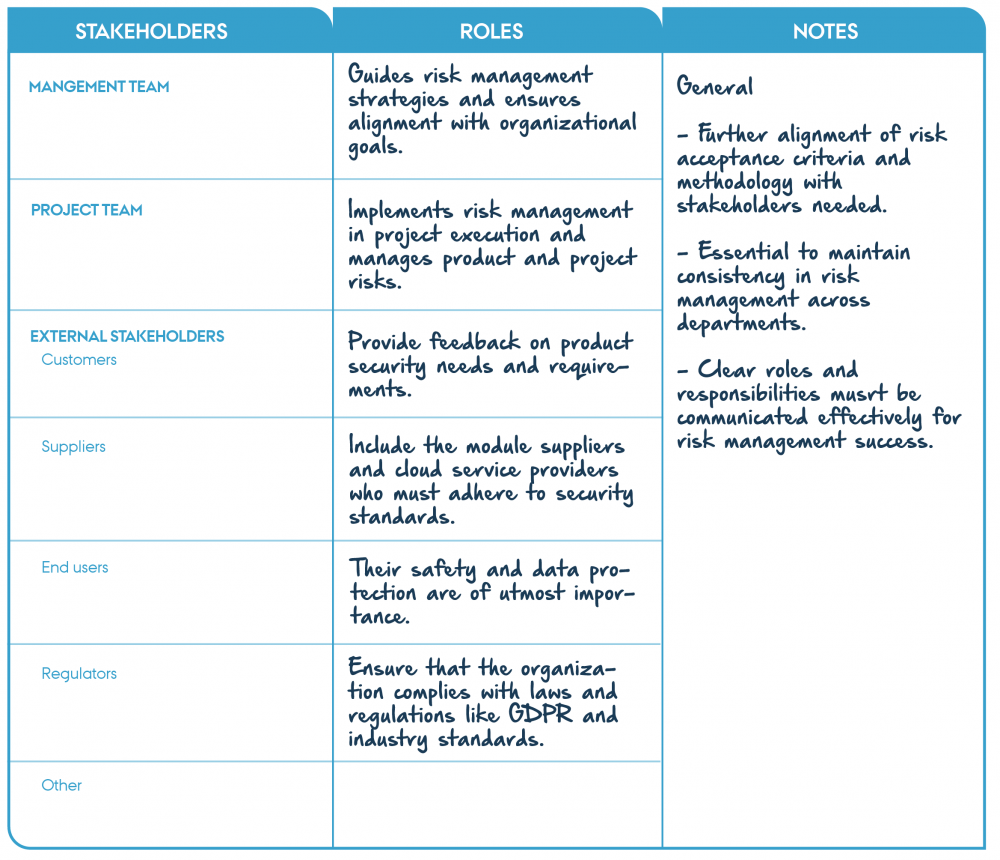
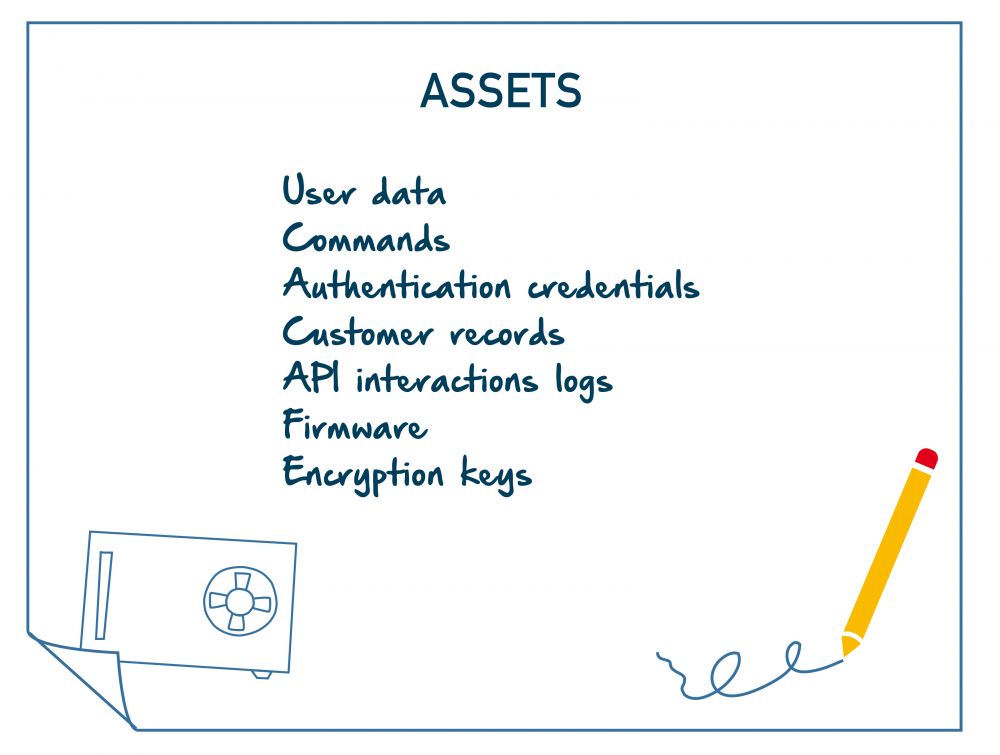
We consider the list of stakeholders from the context establishment module presented below. For identifying the business assets, we engaged stakeholders from the list with insight into the system's value delivery and customer requirements. The identified business assets include information such as authentication credentials and customer service records. These assets were recognised as essential for ensuring secure access, maintaining trust, and adhering to regulatory requirements.
For identifying the technical assets, the technical experts from the stakeholders list examine for example assets stored in databases, transmitted through APIs, and handled by hardware. The identified technical assets include API interaction logs, firmware and software versions, and encryption keys.
The outputs from both perspectives are consolidated to form a unified and detailed list of assets.
Next, we utilise the system diagram to guide our analysis, examining each component's role in the IoT door lock system. Each component is assessed for the data it generates, processes, or stores. For example, the IoT door lock verifies user authentication and handles operational commands, while the IoT gateway manages data transmission between the lock and the cloud. Similarly, the cloud servers are identified as the repository for critical assets such as audit trails, compliance documentation, and analytics data.
After compiling the initial findings, we proceed to the consolidation and verification stage. Here, we remove the redundancies and group the assets for clarity and abstraction. For instance, customer-related information is consolidated under "customer records," encompassing contact details, service requests, and feedback. Note that in some cases, the “general asset” may be covered by the term “information asset”, which is a more appropriate term in the context of cybersecurity.

"Example of stakeholders from Basic requirements 1-2" by CyPro under licence CC BY-SA 4.0

"Asset" by CyPro under licence CC BY-SA 4.0
Download example: Information-centric asset list for IoT door lock system.
Output
The outcome of the process is a list of assets that are vital for the system. These assets represent the information that enables the system to function and create value. The list of assets is used in the subsequent analysis, where the focus is on examining the consequences if an asset is compromised.
In principle, the list can also be used alongside a list of security mechanisms to investigate how the assets are protected.
Expert advice
Generally, it will often be necessary to involve people with technical knowledge of the system in this process. People with business understanding are skilled in identifying conceptual assets but may not have a full understanding of the "invisible" assets that make the system work. Technical experts can provide valuable contributions and identify assets that might not have been discovered otherwise.
It is also advisable to include too many assets than too few at this stage. An asset can always be removed later if it turns out to be irrelevant, but if an asset is left out at this stage, it will not be analysed later; hence, the entire system may not be covered.
In the consolidation and verification stage, it is advisable to have the list verified by individuals who were not directly involved in the brainstorming. If they have questions regarding some of the final descriptions, some elements may have been overlooked.
Next step
After having mapped the assets, the next step is to analyse the consequences if an asset is compromised in terms of confidentiality, integrity, and availability. This is described in more detail in the asset analysis.

The contents described above have been developed in the project:
’CyPro – Cybersecure manufacturing in Denmark’ by Aarhus University, Alexandra Institut, DAMRC, UGLA Insights and FORCE Technology funded by The Danish Industry Foundation. Material from the project is published under Creative Commons.
CyPro
You have completed the entire building block
Get your certificate for this completed building block. Request the certificate and we will send you the personal certificate.


